Where Now, Mr. Dow?
Andrei Pehar from fxKnight.com at 10/20/09
Looking at a very long-term view of the Dow on the weekly chart, price reached a peak high on Oct 7th, 2007 at 14198.00 and reached a low on March 1st, 2009 at 6474.09. As of this writing, the Dow is currently about half-way between the 38.2 and 50.0% retracement levels of this move.
On Oct. 2nd, 2009,
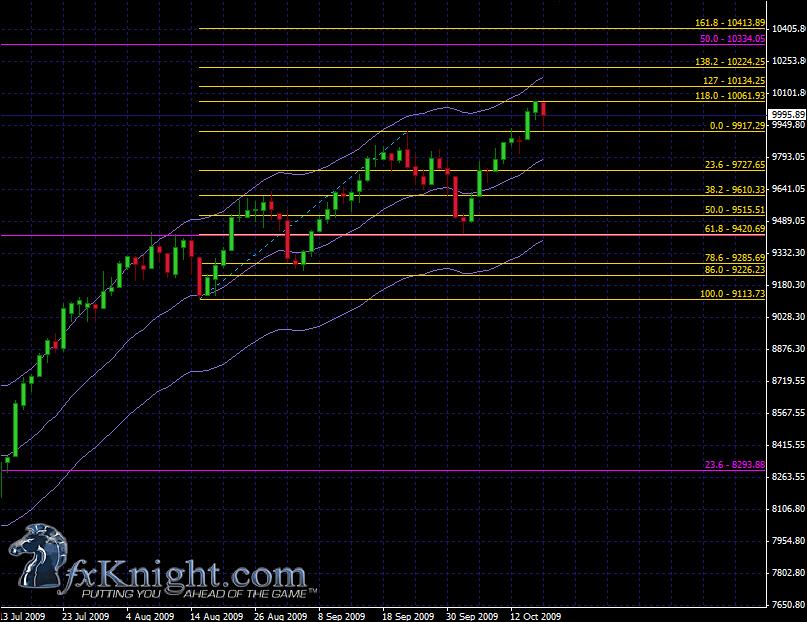
price on the Dow hit the 38.2% level of the weekly Fib, and the 61.8%
retracement level on the daily Fib at 9420.69
Last week price snapped to the 118% extension on the daily and bounced down.
The long-term targets to the
upside would be the 10334.08 at the 50% level on the weekly Fib, and the daily
161.8 extension at 10483.90
Intermediate upside targets along the way would include the 127% daily Fib level at 10134.25 and the 138.2% level at 10224.25
The long-term target in a
downside scenario would be a return to the 38.2 weekly Fib, and the 61.8 level
of the daily at 9420.69
Support levels to watch along the way include 9917.29, 9727.65, and 9610.33