

Chart of the Day – EUR/JPY
James Chen from FX Solutions at 02/09/10
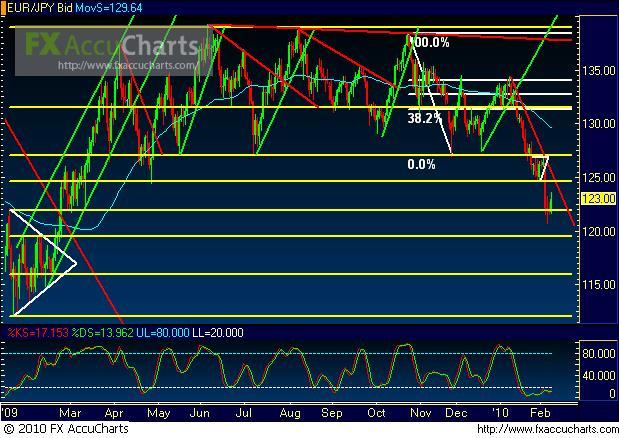
(Chart courtesy of FX Solutions' FX AccuCharts. Price on 1st pane, Slow Stochastics on 2nd pane; horizontal support/resistance levels in yellow; uptrend lines in green; downtrend lines in red; chart patterns in white; 50-period simple moving average in light blue.)
2/09/2010 – EUR/JPY – Price action on EUR/JPY, a daily chart of which is shown, has reached down and made a tentative bounce off key support in the general 122.00 price region. This occurs after the currency pair broke a long sideways consolidation by breaking down below another key support level in the 127.00 price region. The substantial recent bearishness in the pair established a new 11-month low late last week before making the current tentative bounce. Despite the bounce, price action is currently following a very steep medium-term downtrend extending from the mid-January highs. Going forward, the bearish bias could very well continue to prevail. With any strong breakdown and close below the noted 122.00 support region, an immediate downside support target resides around the 119.50 price region. Below that resides key further support around 116.00. Upside resistance within the context of the current steep downtrend resides around the 124.70 price region, which represents the bottom of the last consolidation within the downtrend.
IMPORTANT NOTICE: These comments are for information purposes only. The information contained on this document does not constitute a solicitation to buy or sell by FX Solutions, LLC., and/or its affiliates, and is not to be available to individuals in a jurisdiction where such availability would be contrary to local regulation or law. Opinions, market data, and recommendations are subject to change at any time. Forex trading involves substantial risk of loss and is not suitable for all investors.
