

Chart of the Day – GOLD
James Chen from FX Solutions at 01/29/10
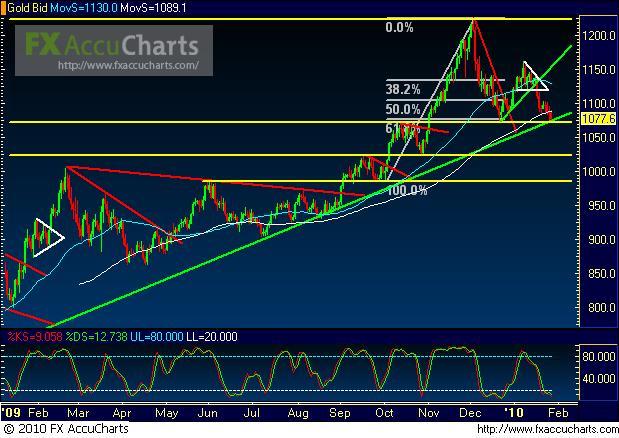
(Chart courtesy of FX Solutions' FX AccuCharts. Price on 1st pane, Slow Stochastics on 2nd pane; horizontal support/resistance levels in yellow; uptrend lines in green; downtrend lines in red; chart patterns in white; 50-period simple moving average in light blue.)
1/29/2010 – GOLD – Recent bearish price action on spot gold, a daily chart of which is shown, has descended all the way down to key support around the 1070 price region, forming a tentative double bottom matching the late December low. In the process, price has also reached down to an important uptrend support line that has defined the gold uptrend for at least well over a year. At the current critical support juncture, gold continues to display a marked bearish bias that threatens to change, or at least interrupt, the longstanding uptrend. In the event of any significant breakdown below the uptrend support line and the noted 1070 support, a key downside support target resides in the 1025 price region.
IMPORTANT NOTICE: These comments are for information purposes only. The information contained on this document does not constitute a solicitation to buy or sell by FX Solutions, LLC., and/or its affiliates, and is not to be available to individuals in a jurisdiction where such availability would be contrary to local regulation or law. Opinions, market data, and recommendations are subject to change at any time. Forex trading involves substantial risk of loss and is not suitable for all investors.
