

Chart of the Day – EUR/USD
James Chen from FX Solutions at 12/14/09
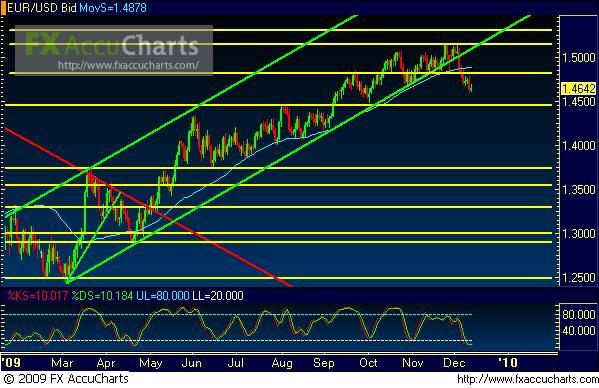
(Chart courtesy of FX Solutions' FX AccuCharts. Price on 1st pane, Slow Stochastics on 2nd pane; horizontal support/resistance levels in yellow; uptrend lines in green; downtrend lines in red; 50-period simple moving average in light blue.)
12/14/2009 – EUR/USD – Price action on EUR/USD, a daily chart of which is shown, has continued its bearish stance after breaking down below the long-prevailing uptrend in the pair about a week ago. This occurs after price hit a 15-month double-tested high around 1.5140. Coming off that high with a clear shooting star candle, price subsequently broke down swiftly below the key uptrend support line extending from the March lows, and then below short-term support around 1.4800. Currently, price is exhibiting signs of a potential bearish trend reversal, with the 1.4450 price region serving as a major downside support target. To the upside, 1.4800 should provide significant resistance within the context of a potential new downtrend for the pair.
* Visit my forex tips and techniques blog here: http://fxpath.fxstreet.com *
IMPORTANT NOTICE: These comments are for information purposes only. The information contained on this document does not constitute a solicitation to buy or sell by FX Solutions, LLC., and/or its affiliates, and is not to be available to individuals in a jurisdiction where such availability would be contrary to local regulation or law. Opinions, market data, and recommendations are subject to change at any time. Forex trading involves substantial risk of loss and is not suitable for all investors.
