

Chart of the Day – USD/CHF
James Chen from FX Solutions at 12/11/09
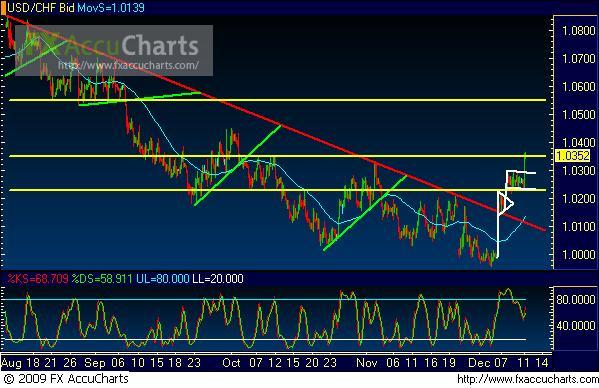
(Chart courtesy of FX Solutions' FX AccuCharts. Price on 1st pane, Slow Stochastics on 2nd pane; horizontal support/resistance levels in yellow; uptrend lines in green; downtrend lines in red; chart patterns in white; 50-period simple moving average in light blue.)
12/11/2009 – USD/CHF – Price action on USD/CHF, a 4-hour chart of which is shown, broke out earlier this month above a downtrend resistance line extending from late July. After that trend break, the bullishness continued with a pennant pattern and breakout, and then an immediate flag-like consolidation pattern. A clean breakout above this flag occurred on Friday (12/11/2009) morning, establishing a new 2-month high for the pair. Having reached and surpassed resistance around the 1.0350 price region, continued dollar bullishness could target further key resistance in the 1.0550 support/resistance region. Tentative downside support within the context of the current bullishness resides around the 1.0300 price region, which represents the approximate top of the noted flag formation.
* Visit my forex tips and techniques blog here: http://fxpath.fxstreet.com *
IMPORTANT NOTICE: These comments are for information purposes only. The information contained on this document does not constitute a solicitation to buy or sell by FX Solutions, LLC., and/or its affiliates, and is not to be available to individuals in a jurisdiction where such availability would be contrary to local regulation or law. Opinions, market data, and recommendations are subject to change at any time. Forex trading involves substantial risk of loss and is not suitable for all investors.
