

Currency Majors Technical Perspective
Ian G Coleman from FXstreet.com Independent Analyst Team at 01/27/10
EURUSD Current price: 1.4069
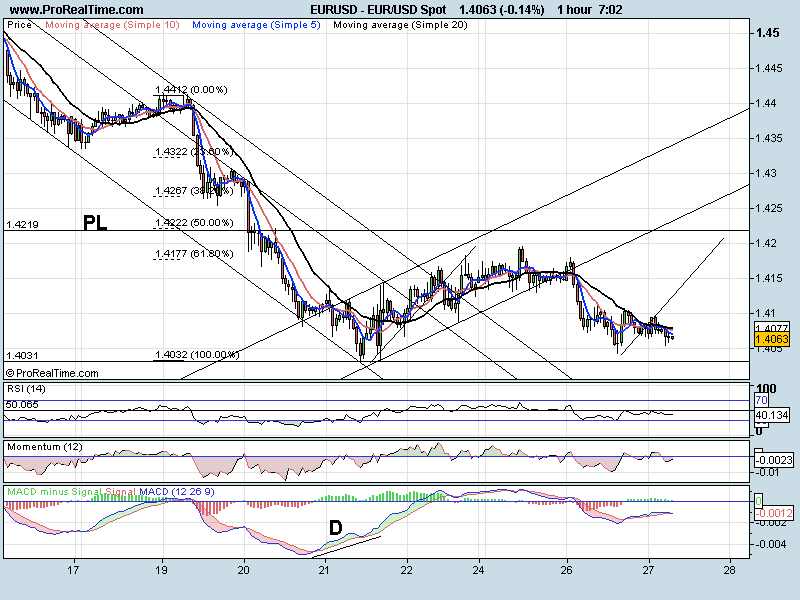
EURUSD little changed overnight. Yesterday we made a move to try to penetrate the previous low at 1.4032 but failed, reaching just 1.4042. We are holding below the 20 SMA at the moment and are making lower lows. Momentum and RSI are both in their sell zones so overall we have a downward bias. However, we are showing some divergence to buy on the 4 hr chart (MACD) so this correction may not be finished yet. 1.4032 is the key level. If we can break there then the bias is strongly to the downside. A move up above 1.4108 and we may see 1.4200 in an ABC correction. We have the FED interest rate decision tonight.
Support levels: 1.4043 1.4031 1.4000
Resistance levels: 1.4096 1.4107 1.4138
GBPUSD Current price: 1.6139
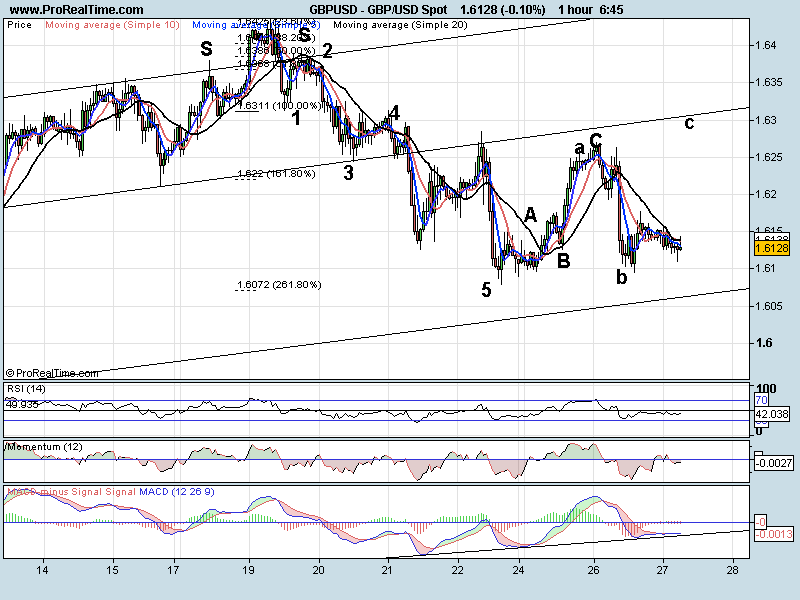
The last hour has formed a doji and we are just trying to push through the 20 SMA as I write. 16100 is showing itself as a formidable low with every attack near that low rejected. We have an ascending trend line on the MACD which is holding at the moment. Elliott Wave theory and I can see this last wave sequence (since the 24th) in two different scenarios. The first calls for a push lower in main wave 3.The other for a correction higher, still in wave C. A push through 16100 and we would have our first option played out with trend line support at 1.6065 as the first target. A move above 1.6177 and we open the door to 1.6300
Support levels: 1.6109 1.6090 1.6065
Resistance levels: 1.6139 1.6177 1.6268
USDJPY Current price: 1.0467
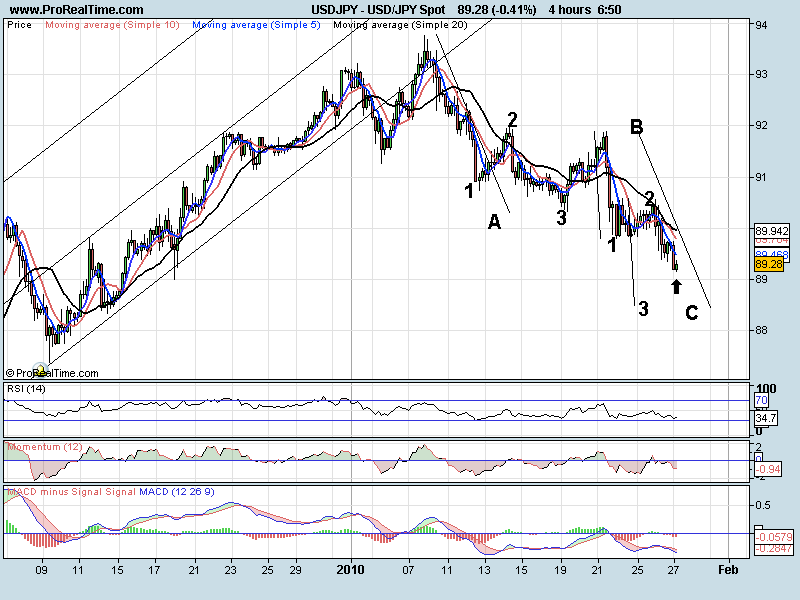
We had that sharp move higher yesterday morning on the news but it was soon pushed lower but failed to make a new high. Now moving lower again in what looks to be an ABC correction. The target area would be 88.50. A move back up above 89.81 would negate this view.
Support levels: 8900 8855 8800
Resistance levels: 8973 8980 9055
USDCHF Current price: 1.0467
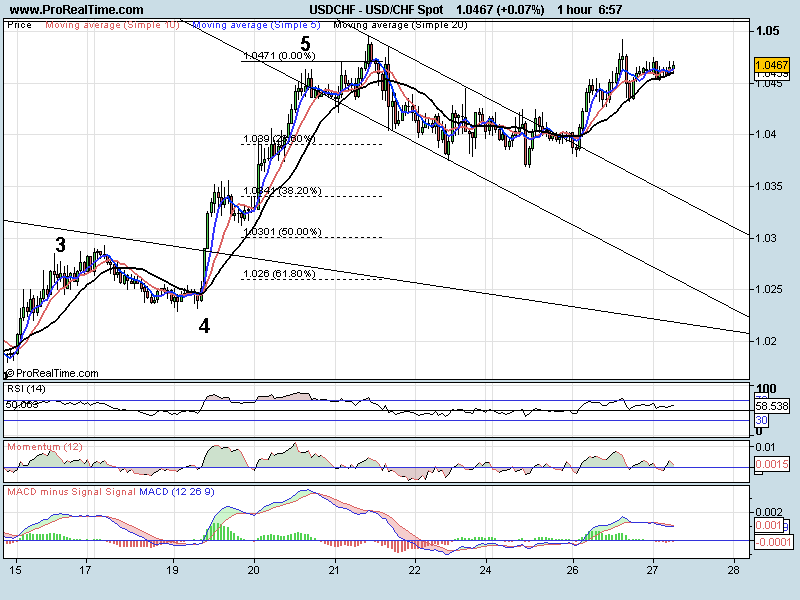
Tried to break 1.0500 the figure yesterday but stopped short. Holding the 20 SMA and making higher highs. Indicators are bullish. We look like we may move higher from here but 1.0500 is the key level. If we can manage to break there it opens the door for much higher highs with 1.0721 and 1.0876 as key areas. A rejection, and we could push back down towards 1.0400
Support levels: 1.0460 1.0432 1.0400
Resistance levels: 1.0475 1.0493 1.0500
Good luck
