

EUR/USD, GBP/US & EUR/GBP−− Get Ready for a Possible Wild Ride Ahead of 2 Rate Decisions and other U.S. Data
Basil Fayadh from eToro USA at 02/04/10
Well, let's look at each pair separately first on an hourly technical level
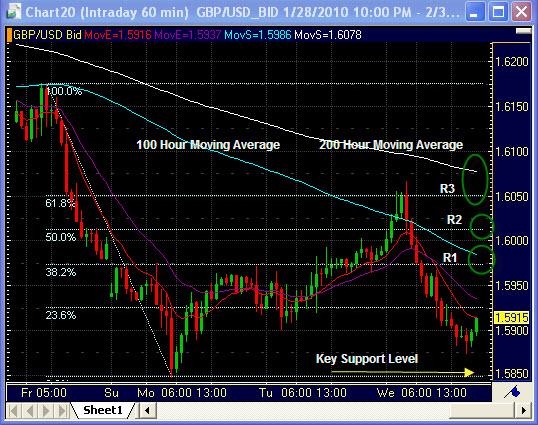
GBP/USD has been in a downtrend on the hourly since last Friday, Jan 29th, until its low, Feb 1st at 1.5848. If we draw a Fibonacci line from these two levels we see that the pair has slowly retraced all the way back up through the 100 hour moving average to the 61.8 % retracement around 1.6050, then almost to the 200 hour moving average and all the way back down hovering now between R1 and key support. Look to resistance levels (R1 & 100 hour MA at 1.5975, R2 1.6000/10, R3& 200 hour MA around 1.6050/75 ) above as good reference points for entries on the downtrend and a break of key support on the downside to next support level around 1.5731 which was the recent low on the daily. Remember the Bank of England Rate Decision and House Price Index Numbers are on Thursday which could potentially have a very strong effect on the pair, along with U.S. employment numbers and Non-Farm Payrolls (see calendar)
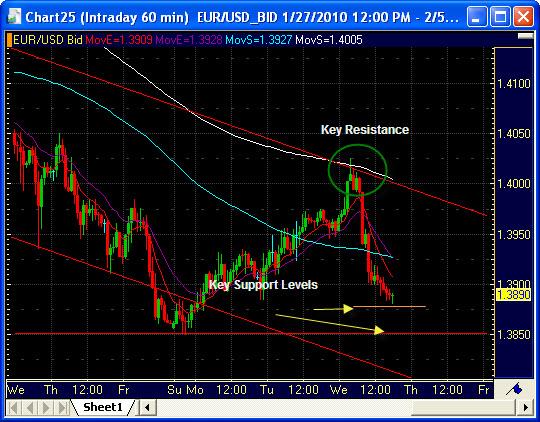
EUR/USD has bounced off Key resistance just underneath the
200 hour moving average and downtrend support line all the way down to its
current support level just around 1.3900. Look
for next key support around 1.3850 with a breach there leading towards lower
lows around 1.3739, and on to levels not seen since last Fe 2009 (1.3300/134.00
level) on daily charts. European Central Bank Rate Decision on Thursday (see calendar below) which could potentially have a very large impact on the pair,as well along with U.S. employment numbers and Non-Farm Payrolls (see calendar)
EUR/GBP
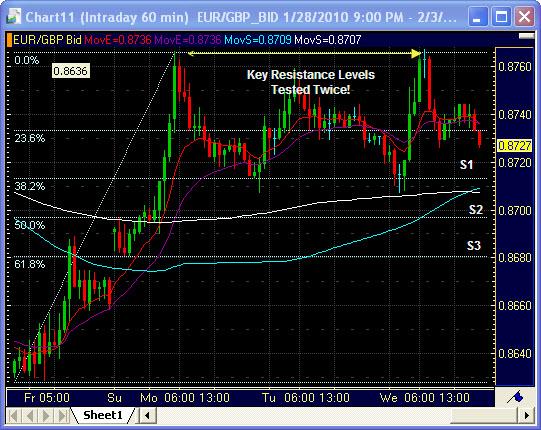
EUR/GBP has tested Key Resistance twice on its move from last Friday Jan 29th at .8640 up to the highs tested twice at .8766 on Feb 1st and also on Feb 3rd (.8767 incidentally!) Look for support levels at Fibonacci retracements (S1 .8713, S2 .8697/00, S3 .8680 ) with a breach through 3rd support level possibly leading back down to the low at .8640 On the topside a break there possibly leading back up to .8840 and on to .8990 levels (100 Day and 200 Day moving averages respectfully). This pair will definitely be affected by above, but could also be caught in a tug of war.
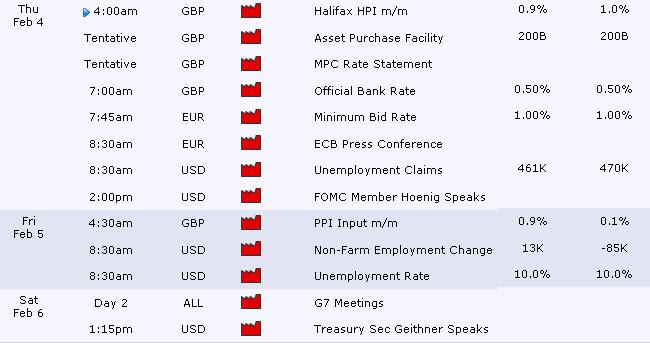
Remember to look for technical analysis for entry/exit points and fundamentals for direction in the market. There is certainly a slew of economic data coming out over the next few days as follows in the Eurozone, Great Britain and the United States, so remember my earlier posts on breaks, maybe look for a re-touch before an entry and always make sure to follow the 10 trading rules!
1. Never Let a Winner Turn Into a Loser
2. Logic Wins, Impulse Kills
3. Never Risk More Than 2% per Trade
4. Trigger Fundamentally, Enter and Exit Technically
5. Always Pair Strong With Weak
6. Being Right but Being Early Simply Means That You Are Wrong
7. Know the Difference Between Scaling In and Adding to a Loser
8. What is Mathematically Optimal Is Psychologically Impossible
9. Risk Can Be Predetermined, but Reward Is Unpredictable
10. No Excuses, Ever
Good Luck, Good Trading
Views in my postings are purely opinion and are not meant to be taken as trading advice.
Charts powered by FX Solutions Accucharts
Forex Glossary by FX Words
European Central Bank -(ECB)-European Central Bank (ECB). The central bank empowered to manage monetary policy for the Euro-zone - the group of countries that use the Euro single-currency.
Similar to the Federal Reserve System in the United States, the E.C.B., European Central Bank's goal is to maintain price stability and stable growth. The governing body consists of the six member Executive Board, and twelve governors representing the current twelve member Euro-zone countries (twelve as of late 2006, more countries are slated to join shortly). The ECB formed June 1, 1998
For more details please refer to their home page: http://www.ecb.int/home/html/index.en.html
Bank of England -BOE- The Bank of England is the central bank for the United Kingdom. It has a wide range of responsibilities, similar to those of most central banks around the world. For example, it acts as the government's bank and the lender of last resort, it issues currency and, most importantly, it oversees monetary policy.
Moving Averages-
What is a moving average?
Moving averages simply measure the average price or exchange rate of a currency pair over a specific time frame. For example, if we take the closing prices of the last 10 days, add them together and divide the result by 10, we have created a 10-day simple moving average (SMA).
There are also exponential moving averages (EMAs). They work the same as a simple moving average, except they place greater weight on the more recent closing prices. The mathematics of an exponential moving average is complex, but fortunately for trackers, most charting packages calculate them automatically and instantaneously.
Parameters. The most commonly used time frames for moving averages are 10, 20, 50, and 200 periods on a daily chart. As always, the longer the time frame, the more reliable the study. However shorter term moving averages will react more quickly to the market's movements and will provide earlier trading signals.
10, 20, 50 and 200-Day SMAs on non-Daily Charts
Also note that as you change your time frame in the chart (say,
changing a daily chart into an hourly), the moving average will need to
change too. If you want a 10-day moving average line on an hourly
chart, you would need a 240-hour SMA (that is 10-day times 24 hours).
The Fibonacci sequence, named for its discoverer Leonardo Fibonacci, forms the basis for Elliott Wave theory used in trading financial markets. Out of Elliott Wave theory comes Fibonacci retracements and Fibonacci arcs discussed below. The Fibonacci sequence is 1,1,2,3,5,8,13,21,,34,55,89... to infinity. The sum of two consecutive numbers equals the next number. The ratio of any number to its next highest number approaches .618. The ratio of alternating numbers approaches .382. Also, 1 - .618 = .382. The midpoint of .382 and .618 is .50. This is why .382, .50, and .618 are used.
Retracements in technical analysis, Fibonacci retracements approximate support and resistance (and potential turning points) following a trend. Calculate the distance from the low to the high of the trend and calculate 38.2%, 50%, and 61.8% of the distance of the trend. Subtract those values from the top of the trend. Those are the potential reversal points. Charting packages perform the calculations for you - all you have to do is connect the low of the trend with the high of the trend using the Fibonacci retracement tool.
